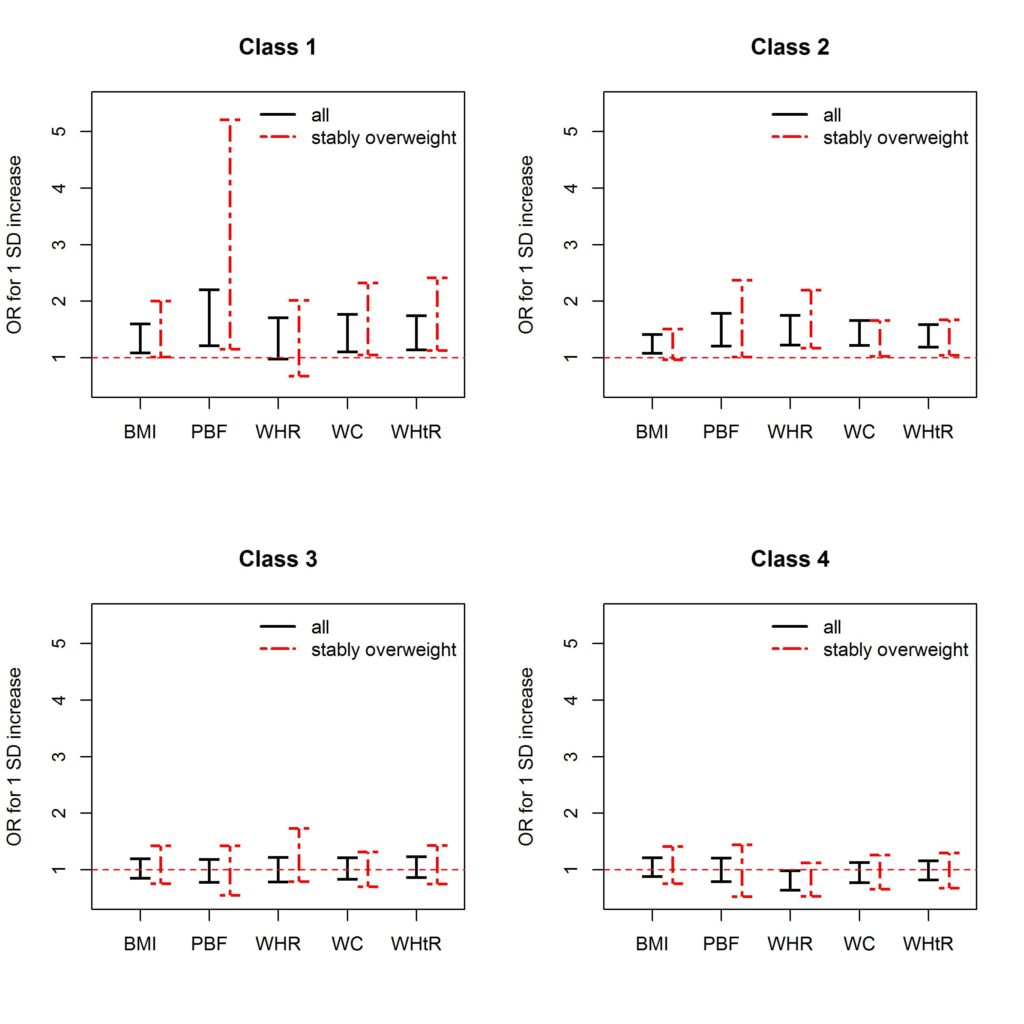
This is an example of how to visualize odds ratio using generic plotting functions in R, e.g. functions from {base} and {graphics} packages.
By applying multinomial regression using R package {nnet}, odds ratio was calculated separately for asthma classes and for different obesity metrics. And the same model was fitted restricted to stably overweight participants as a sensitivity analysis. Odds ratios for different obesity metrics were plotted side-by-side for comparison, and the odds ratios from the main model and from the sensitivity analysis were distinguished by color and line type. See the original publication for details.
### Not to run ###

library(nnet)

# multinomial regression on different obesity measures
model <-
  'lc.w.ref ~ age_s3 + sex_s1 + educ_cum + smok_cum_s3 + area_s3 + '

obesity <- c('bmi_s3', 'pbf_kyle_s3', 'waist_hip_ratio_s3', 'waist_s3',
             'waist_height_ratio_s3')

tab.all <- list()
for(obe in obesity){
  test.model <- as.formula(paste0(model, obe))
  test <- multinom(test.model, data = subd)

  # calculate the p values manually
  z.values <- summary(test)$coefficients/summary(test)$standard.errors
  p.values <- pnorm(abs(z.values), 0, 1, lower.tail = FALSE) * 2

  # produce the coefficient table for each class
  tab.all[[obe]] <- list()
  for(class in rownames(coef(test))){
    tab.all[[obe]][[class]] <-
      data.frame(beta = coef(test)[class, ],
                 se = summary(test)$standard.errors[class, ],
                 p.value = p.values[class, ])
  }
}

# multinomial regression on different obesity measures,
# restricted to the stably overweight
model <-
  'lc.w.ref ~ age_s3 + sex_s1 + educ_cum + smok_cum_s3 + area_s3 + '

obesity <- c('bmi_s3', 'pbf_kyle_s3', 'waist_hip_ratio_s3', 'waist_s3',
             'waist_height_ratio_s3')

tab.stab <- list()
for(obe in obesity){
  test.model <- as.formula(paste0(model, obe))
  test <- multinom(test.model, data = subd)

  # calculate the p values manually
  z.values <- summary(test)$coefficients/summary(test)$standard.errors
  p.values <- pnorm(abs(z.values), 0, 1, lower.tail = FALSE) * 2

  # produce the coefficient table for each class
  tab.stab[[obe]] <- list()
  for(class in rownames(coef(test))){
    tab.stab[[obe]][[class]] <-
      data.frame(beta = coef(test)[class, ],
                 se = summary(test)$standard.errors[class, ],
                 p.value = p.values[class, ])
  }
}

# compute the odds ratios
or.all <- list()
for(obe in names(tab.all)){
  or.all[[obe]] <- data.frame(OR = NULL, lower = NULL, upper = NULL)
  for(class in names(tab.all[[obe]])){
    beta <- tab.all[[obe]][[class]][obe, 'beta']
    se <- tab.all[[obe]][[class]][obe, 'se']
    or.all[[obe]][class, 'OR'] <- exp(beta)
    or.all[[obe]][class, 'lower'] <- exp(beta - qnorm(0.975) * se)
    or.all[[obe]][class, 'upper'] <- exp(beta + qnorm(0.975) * se)
  }
}
or.stab <- list()
for(obe in names(tab.stab)){
  or.stab[[obe]] <- data.frame(OR = NULL, lower = NULL, upper = NULL)
  for(class in names(tab.stab[[obe]])){
    beta <- tab.stab[[obe]][[class]][obe, 'beta']
    se <- tab.stab[[obe]][[class]][obe, 'se']
    or.stab[[obe]][class, 'OR'] <- exp(beta)
    or.stab[[obe]][class, 'lower'] <- exp(beta - qnorm(0.975) * se)
    or.stab[[obe]][class, 'upper'] <- exp(beta + qnorm(0.975) * se)
  }
}

# visualize odds ratios with 95% confidence interval
jpeg('results/figure2_odds_ratio.jpg', width = 3000, height = 3000, res = 400)
layout(matrix(1:4, 2, 2, byrow = TRUE))
for(i in 1:4){
  lower.all <- unlist(lapply(or.all, function(x)
    x[paste0('class', i), 'lower']))
  upper.all <- unlist(lapply(or.all, function(x)
    x[paste0('class', i), 'upper']))
  lower.stab <- unlist(lapply(or.stab, function(x)
    x[paste0('class', i), 'lower']))
  upper.stab <- unlist(lapply(or.stab, function(x)
    x[paste0('class', i), 'upper']))
  plot(0, type = 'n', xlim = c(0.5, 5.5), ylim = c(0.5, 5.5),
       ann = FALSE, xaxt = 'n')
  title(main = paste('Class', i), ylab = 'OR for 1 SD increase')
  axis(1, at = 1:5, labels = c('BMI', 'PBF', 'WHR', 'WC', 'WHtR'))
  arrows(1:5, lower.all, 1:5, upper.all,
         code = 3, angle = 90, length = 0.075, lwd = 2, lend = 'butt')
  arrows(1:5+.3, lower.stab, 1:5+.3, upper.stab,
         code = 3, angle = 90, length = 0.075, lwd = 2, lend = 'butt',
         lty = 6, col = 2)
  abline(h = 1, lty = 2, col = 2)
  legend('topright', legend = c('all', 'stably overweight'),
         bty = 'n', lty = c(1, 6), lwd = 2, col = 1:2)
}
dev.off()
