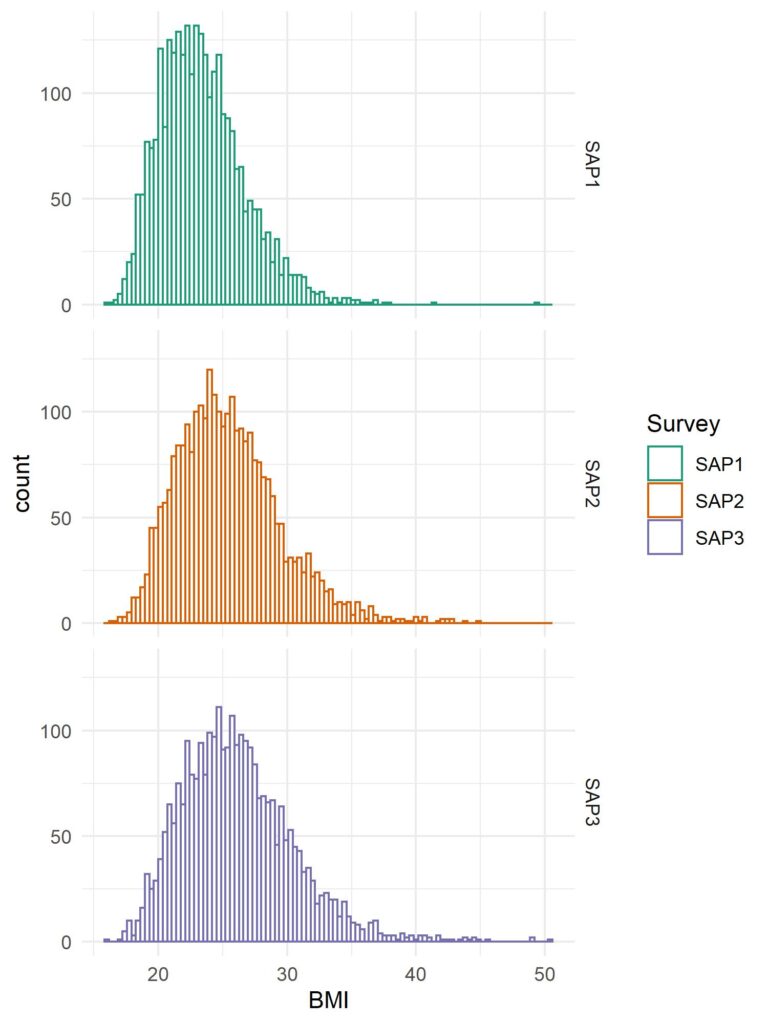
This is an example of a panel histogram using R package {ggplot2}. This figure was reported in the supplementary material of this paper.
### Not to run ###

library(ggplot2)

# BMI from each survey
bmi_s1 <- d.all[d.all$pid %in% c(d.cs$pid, d.pr$pid), 'bmi_s1']
bmi_s2 <- d.all[d.all$pid %in% c(d.cs$pid, d.pr$pid), 'bmi_s2']
bmi_s3 <- d.all[d.all$pid %in% c(d.cs$pid, d.pr$pid), 'bmi_s3']
d.plot <- data.frame(BMI = c(bmi_s1, bmi_s2, bmi_s3),
                     Survey = rep(c('SAP1', 'SAP2', 'SAP3'),
                                  each = length(bmi_s1)))

# histrogram
jpeg('results/bmi_distribution.jpg', width = 1500, height = 2000, res = 300)
ggplot(d.plot, aes(x=BMI, color=Survey)) +
  geom_histogram(fill='white', stat='bin', bins=100) +
  facet_grid(Survey~.) +
  scale_color_brewer(palette='Dark2') +
  theme_minimal()
dev.off()
