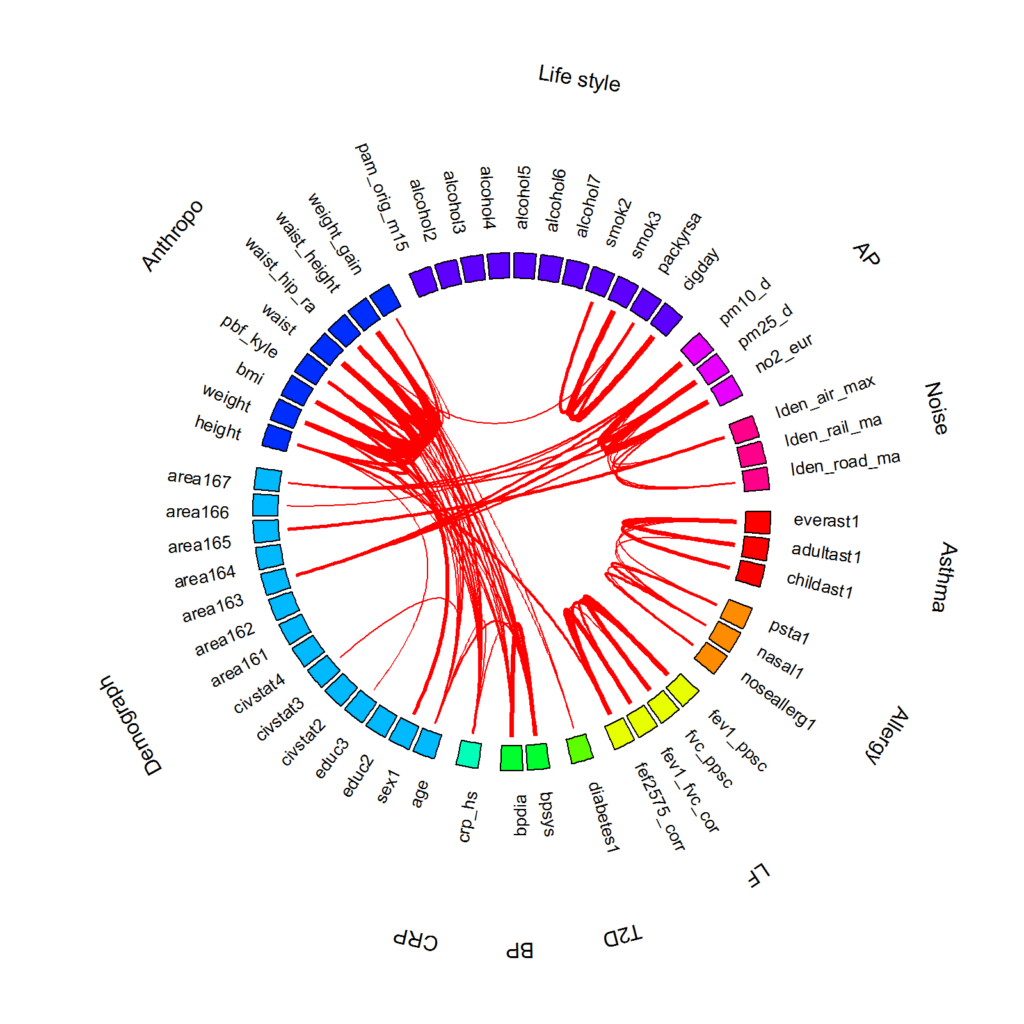
This is an example of a correlation globe drawn using R package {circlize}. Two nodes are connected if the correlation is greater than 0.2 and permutation-based p-value is smaller than 0.05 after multiple testing correction. Positive and negative correlations are shown in red and blue, respectively.
### Not to run ###

library(circlize)

# read in data
d <- readRDS('data/covariates_sap3.rds')

# model matrix with dummy variables
orig <- options(na.action = 'na.pass')
x <- model.matrix(~ ., d)
options(orig)
x <- x[, colnames(x) != '(Intercept)']

# manually define variable names and classes
v <- data.frame(name = colnames(x), class = NA, stringsAsFactors = F)
v$class[grepl('ast', v$name)] <- 'Asthma'
v$class[grepl('psta', v$name) | grepl('nasal', v$name) |
          grepl('nose', v$name)] <- 'Allergy'
v$class[grepl('fev', v$name) | grepl('fvc', v$name) |
          grepl('fef', v$name)] <- 'LF'
v$class[grepl('diabetes', v$name)] <- 'T2D'
v$class[grepl('bp', v$name)] <- 'BP'
v$class[grepl('crp', v$name)] <- 'CRP'
v$class[grepl('age', v$name) | grepl('sex', v$name) | grepl('educ', v$name) |
          grepl('civstat', v$name) | grepl('area', v$name)] <- 'Demograph'
v$class[grepl('height', v$name) | grepl('weight', v$name) |
          grepl('waist', v$name) | grepl('bmi', v$name) |
          grepl('pbf', v$name)] <- 'Anthropo'
v$class[grepl('pam', v$name) | grepl('alcohol', v$name) |
          grepl('smok', v$name) | grepl('packyr', v$name) |
          grepl('cigday', v$name)] <- 'Life style'
v$class[grepl('pm', v$name) | grepl('no2', v$name)] <- 'AP'
v$class[grepl('lden', v$name)] <- 'Noise'
v$class <- factor(v$class, levels = c('Asthma', 'Allergy', 'LF', 'T2D', 'BP',
                                      'CRP', 'Demograph', 'Anthropo',
                                      'Life style', 'AP', 'Noise'))
v$name <- factor(v$name, levels = v$name)

# read in pairwise correlation calculated previously
d.corr <- readRDS('results/correlation_all_pairs.rds')
d.link <- d.corr[p.adjust(d.corr$p, 'fdr') < 0.05, -4]
d.link <- d.link[abs(d.link$corr) > 0.2, ]

# correlation globe
png('results/correlation_globe.png', res = 200, height = 1600, width = 1600)

circos.par(track.height = 0.1, gap.after = 5)
circos.initialize(
  factors = v$class,
  xlim = data.frame(rep(0, 11), tapply(v$name, v$class, length))
)
circos.track(
  factors = v$class, ylim = c(0,1), bg.border = NA,
  panel.fun = function(x, y){
    circos.text(CELL_META$xcenter, CELL_META$ylim[2], CELL_META$sector.index)
  })
circos.clear()

par(new = TRUE)
gap <- rep(1, nrow(v))
gap[cumsum(tapply(v$name, v$class, length))] <- 5
rect.col <- rainbow(11)[as.numeric(v$class)]
names(rect.col) <- as.character(v$name)
circos.par(
  track.height = 0.1, gap.after = gap, cell.padding = c(0.01,0,0.01,0),
  canvas.xlim = c(-1.5, 1.5), canvas.ylim = c(-1.5, 1.5))
circos.initialize(factors = v$name, xlim = c(0,1))
circos.track(
  factors = v$name, ylim = c(0,1), bg.border = NA,
  panel.fun = function(x, y){
    circos.text(CELL_META$xcenter, CELL_META$ycenter,
                substr(CELL_META$sector.index, 1, 12), facing = 'clockwise',
                niceFacing = TRUE, cex = 0.8, adj = c(0, 0))
  })

circos.track(
  factors = v$name, ylim = c(0,1), bg.border = NA,
  panel.fun = function(x, y){
    circos.rect(CELL_META$xlim[1], CELL_META$ylim[1], CELL_META$xlim[2],
                CELL_META$ylim[2], col = rect.col[CELL_META$sector.index])
  })

for(i in 1:nrow(d.link)){
  line.col <- ifelse(d.link[i, 3] > 0, 'red', 'blue')
  circos.link(d.link[i, 1], 0.5, d.link[i, 2], 0.5,
              col = line.col, lwd = abs(d.link[i, 3])*5)
}
circos.clear()

dev.off()
